The economy which we operate today is largely based on a one-way journey of natural resources – from source to sink:
Figure 1: Our economy depends both on the availability of natural resources and on the ability of the environment to deal with the wastes that we produce.
However, oil, like other fossil fuels, is a non-renewable resource, in other words it is not replenished by nature – it can only be used once. The source of oil is finite. Furthermore the use of oil leads to emissions of CO2 whose natural sinks are already saturated. Given the importance of oil to the economy it is not surprising that there has been a lot of debate about whether the Source or the Sink would ever limit our use of this resource, and when those limits would arrive.Amongst all the resources that we use oil is particularly important. It has been the availability of huge quantities of very cheap oil that has powered the unprecedented economic growth of the last century, just as coal was the energy source that underpinned the Industrial Revolution in the years before. Oil has wondrously been described as “fossilised sunlight” because it is derived from the sun that fell on plants over thousands of years. Oil is an incredible material –it is very portable, its derivatives – gasoline/petrol, diesel etc. – are volatile and so can drive combustion engines and as chemical feedstock oil underpins a huge range of industries. Oil also has around one and half times the energy density of coal and over four times that of wood – one litre of gasoline/petrol contains 32 MJ or 8.5 kWh – which is equivalent to about 8.5 days of human labour[1]! It is because we have had a plentiful supply of cheap, transportable energy that we have been able to create surpluses of wealth to reinvest in more resource extraction and so put in motion the remarkable economic growth seen this century. Cheap oil (and other fossil fuels) are so important to the global economy, accounting for about 5% of global expenditure as a percent of GDP (see [ murphy2011energy ]fig 5), that governments have spent $400bn subsidising these in 2010, through tax breaks and other mechanisms, according to the International Energy Agency[ IEA2010world ] [ cowe2012energy ].
The data on oil reserves has never been entirely transparent – oil company share prices and OPEC country voting rights are both based on stated reserves so there is clearly an incentive to be optimistic in the amount of extractable oil. However in 2010 the International Energy Agency finally acknowledged what many commentators had been saying for years – that “peak oil” production had arrived several years ago:
Crude oil output reaches an undulating plateau of around 68‑69 mb/d by 2020, but never regains its all‑time peak of 70 mb/d reached in 2006[ IEA2010world ]
The IEA did go on to say there would be another 25 or so years where synthetic fuels and unconventional oils may grow slightly to fill the gap, but these too will peak in 2035 and possibly as early as 2020.
It is important to note that “peak oil” doesn’t mean that we are physically running out of the stuff. What we are running out of is cheap oil from existing oil fields, and so we rely increasingly on new fields like Macondo in the Gulf of Mexico, scene of the Deepwater Horizon tragedy and spill, where the oil is in a relatively small pocket of 50m barrels located 40 miles offshore in the Gulf of Mexico under 1,500 meters of water and a further 4,000 meters of sediment and rock, or on tar sands and oil shales where much larger amounts of energy and water are required to extract the oil. Peak oil means that the oil that remains is becoming much harder to find, will require much more capital (and risk) to extract and will inevitably cost much more to provide than current oil supplies, so production has been limited, i.e. “peaked”, as a result of these cost factors. Peak oil should be better referred to as “peak oil production”.
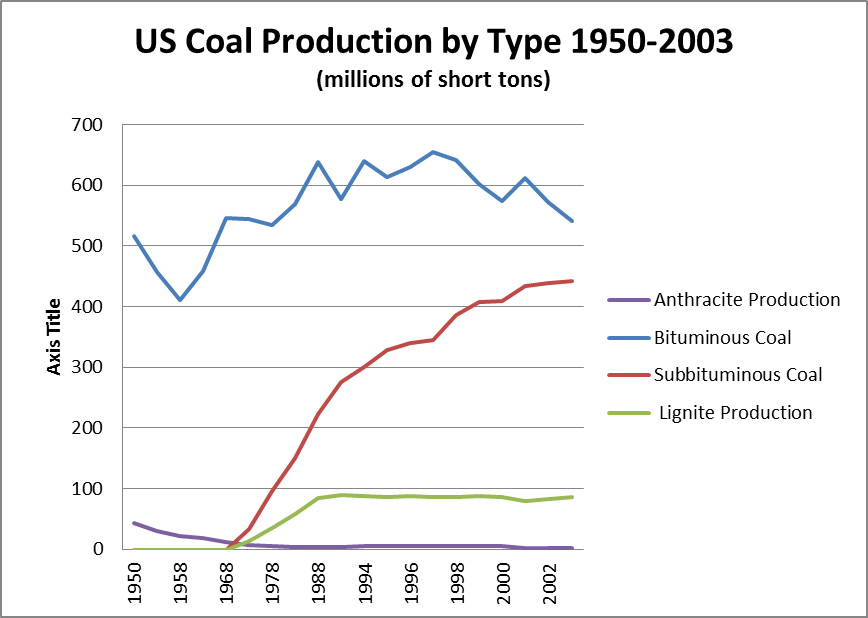
Similar issues relate to a supposedly plentiful fossil fuel – coal. For example, in the US the premier “quality” coal, black anthracite, almost pure carbon, has to all extents, been depleted, so that now the major production is of bituminous coal, providing slightly less energy per kg than anthracite; next is sub-bituminous and last of all lignite, sometimes known as brown coal which is low in energy and high in moisture. It is only as access to the better grades of coal has become more difficult that we have had to resort to the poorer ones, as illustrated in the chart below.
Figure 2 Historic trend in US coal production 1950 to 2002 showing the decline in better quality types and the resulting increase in production of poorer grades. Source adapted from “Coal Production in the United States – a Historic Overview”, Energy Information Agency. {http://www.eia.gov/FTPROOT/coal/coal_production_review.pdf}
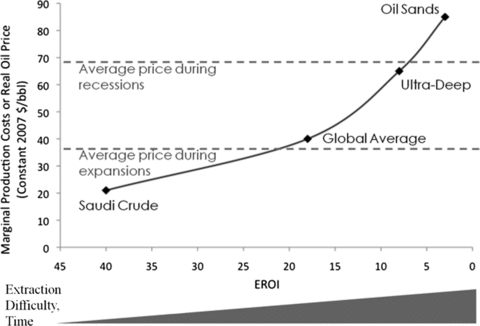
So we can see that the issue of Sources is really about the availability of cheap resources. As we deplete the best quality fossil fuels, those that remain require more energy to extract (the energy return on energy invested, EROEI, declines), so the net energy falls. Not only does this increase the cost but for the same net amount of energy to enter the economy we will need to extract ever- increasing quantities of the fossil fuel. As more and more energy is diverted into producing resources and meeting the basic needs of life the surplus which is available to invest in more productive capital (factories etc.) or used in discretionary consumption (tv’s, fridges, cars etc.), becomes smaller.
Figure 3 – Oil Production costs in comparison with the Energy Return on Investment for various sources. The dotted lines represent the average of real oil prices during expansionary and recessionary periods. Note that the production costs are not the same as the total cost of oil which includes processing, transportation etc.[ murphy2011energy ]
There is another, potentially more significant, limit on our use of fossil fuels, the availability of Sinks which remove the waste CO2 that their combustion produces. In simple terms there is a finite budget of Carbon that we can emit to the atmosphere over the next 40 years if we are to achieve our stabilisation objectives. The implication of this is that, unless we can capture and store the CO2 emissions from fossil fuels, half of all known reserves will have to stay in the ground[ meinshausen2009greenhouse ]. We simply cannot keep global warming anywhere near 2oC if all that carbon is released. This has huge implications for the future valuation of all fossil-fuel industries; for it seems that the market has not yet factored in the possibility that half the assets of these businesses are potentially going to remain stranded under the earth. If carbon capture and storage is viable, and we hope that it is, it will add significantly to the energy used at the power plant (11-40% depending on the technology used)[ IPCC2005CCS ] as well as to the overall cost of the electricity produced.
A consequence of a fixed budget of Carbon is that we need to think about the amount of CO2 that the various fossil fuels emit per unit of electricity generated. This varies depending on the technology and the grade of fossil fuel but in the UK, taking into account extraction and transportation of the fuel (i.e. Scope 3 emissions, see later on page xxx), the figures[ Defra2011GHG ]are as follows:
|
Fuel |
kg CO2e emitted per kWh electricity generated |
kWh electricity generation per kg CO2e emitted |
| Coal | 0.398 | 2.511 |
| Fuel Oil | 0.333 | 3.007 |
| Natural Gas | 0.224 | 4.461 |
| Wood Logs/Chips | 0.020 | 50.000 |
Figure 19 The Scope 3 CO2 equivalent emissions of a range of fossil fuels, per kWh of electricity generated. Source Defra and DECC UK, 2011.
So we can see that we can get almost twice the amount of electricity from natural gas per kg CO2 emitted as we can from coal (or in other words natural gas emits almost half the CO2 as coal per unit electricity generated). This means that we can make our limited carbon budget stretch further by using natural gas for power generation in preference to coal. It clearly makes sense for us to focus on gas as the “bridging fossil fuel” during the transition to low-carbon electricity generation based entirely on renewables. It would not be an unreasonable assumption that future policy will favour natural gas over coal, although issues such as security of supply and market price may still favour coal in certain regions.
[1] A human expends about 100 Watts per hour in hard physical labour and assuming that they do 10 hours a day work that is 1 kWh per day (keeping the maths simple – the true figure is actually lower).


0 Comments