Monitoring and Targeting (M&T) is a key technique in energy and resource efficiency, which has been widely applied globally across public sector, commercial and industrial facilities. The SustainSuccess team have over 25 year’s elapsed experience in M&T covering literally hundreds of facilities in a huge variety of sectors worldwide, and support for M&T is one of the core services we can provide for clients seeking energy and resource efficiency and cost reductions.
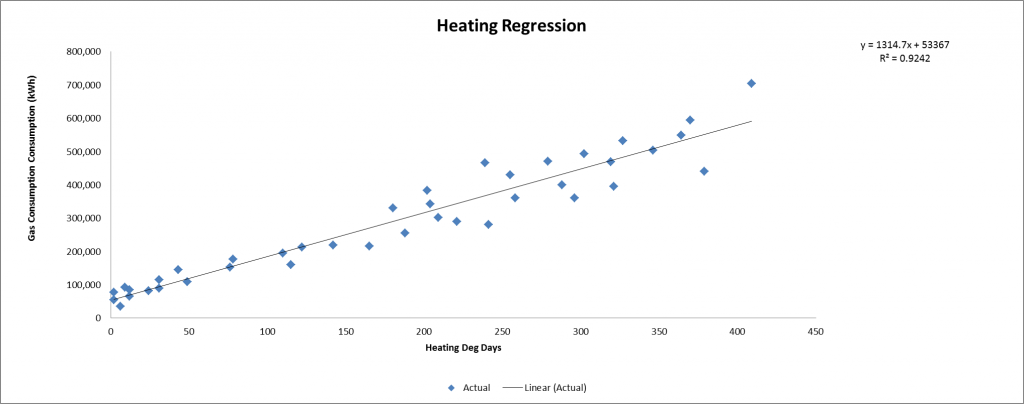
M&T is a proven technique, which provides the means of evaluating energy consumption in relation to external “drivers” such as weather, production volume or product mix. The technique most widely used to create this comparison is Regression Analysis, although other forms of mathematical relationships may also be appropriate. An example of a regression analysis chart, comparing Gas consumption with Heating Degree Days (how cold it is) is shown below (this is real data from a retailer). Once a relationship is established which has a good degree of correlation, then individuals can be made responsible for that energy usage. This ability to separate out “good” and “poor” performance on a daily, weekly or monthly basis leads to better control of energy and a better understanding of the sources of variability. The result is considerable no and low cost savings: typically 5-15% in industrial applications and 5-25% in buildings and the public/commercial sector.
There are a number of excellent commercial M&T software applications in the market such as Montage (which Niall Enright was responsible for developing over a number of years),EIServer, Carbon Desktop, Stark, eSight, Team Sigma and others.
However SustainSuccess have had a number of projects where the relatively small scale of the energy usage or where limited nature of a “proof of concept” pilot meant that installing a commercial system would be infeasible or uneconomical. As a result we have developed a tool called MATOD (short for Monitoring and Targeting and Opportunities Database) in excel, which provides a low cost entry point for monitoring and targeting.
Despite being built in excel, MATOD nevertheless has a number of powerful features which make the M&T process easy:
- All Meter Readings on a single sheet, including high and low value validation
- Variable (e.g. Weather, production etc.) on a single sheet, including high and low value validation
- Single sheet entry for cost data, which can change over time
- Energy Account Centres established using simple drop-down selections
- Simple target-setting module incorporates multiple original and target equations
- Single and Multiple Regression equations supported, as well as year-on-year comparison and average.
- MATOD estimates savings potential from baseload improvement and from reduction in variability
- Energy Account Centres can be aggregated to site level
- Multilingual (Czech and English versions available currently, but additional languages are not a problem).
- Support for dual currencies (both can be displayed simultaneously)
The illustration below shows the full-page report produces by MATOD.
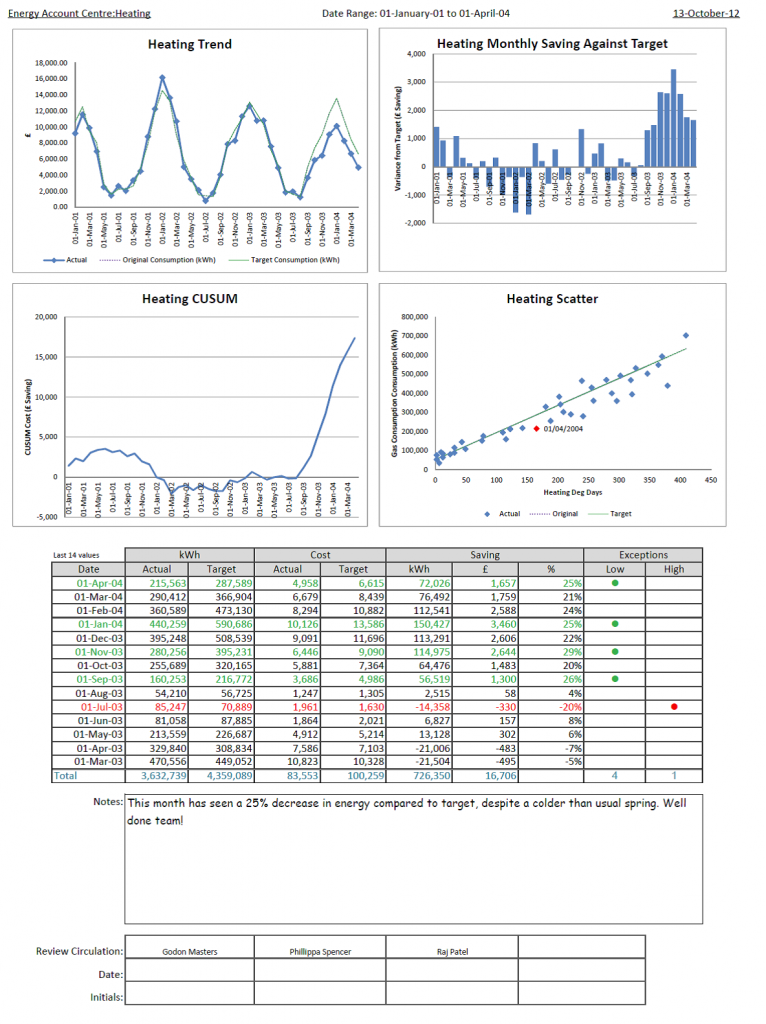
You will see that there are four graphs displayed in this report, which are all highly customisable, from left to right and top to bottom: a Trend over time with optional target and/or original lines; a Variance against target; a CUSUM (Cumulative Sum) against original; and a Scatter plot with target and/or original line shown, and with any number of the “last N” data points labelled (in this example we have just the last data point labelled).
All these charts can independently show either cost (£,€,$ etc.) with an optional second currency on the right axis, or the meter units e.g. kWh. In the CUSUM chart there is an option to show savings as a positive figure (e.g. CUSUM of savings, as in this example) or savings as a negative figure (as in CUSUM of cost).
The four charts can be re-ordered and shown in any of the four positions by simply selecting from a drop-down menu, or omitted from the report entirely.
Below the graphs there is a table of the last 14 periods. Rows can be highlighted as positive (green) or negative (red) exceptions on the basis of a different percentage variance from target for in each case, with an override that sets a minimum cost before an exception is triggered (thus avoiding false-positives when consumption are low). The rows in this table can be displayed ascending or descending by date. And the highlighting of the text in red or green can be switched on or off.
In addition to the MATOD sheet SustainSuccess can provide a number of data import worksheets which can extract data from third-party systems; process the data to create the necessary aggregated daily, weekly or monthly values; validate and error-check the data; and then post the data to the correct cells in MATOD. These routines are quick and easy to adapt for different file structures so if you would like to automate the data entry into MATOD, please supply us with an example file.
SustainSuccess would always recommend the use of a commercial software application for M&T and we have extensive expertise in a number of the major packages listed above, and can assist in the selection of any of these packages as well as their implementation. However if the scale or budget for the project do not permit such a tool, then MATOD will be a low-cost alternative developed by a team who have over 25 years experience in M&T.


0 Comments