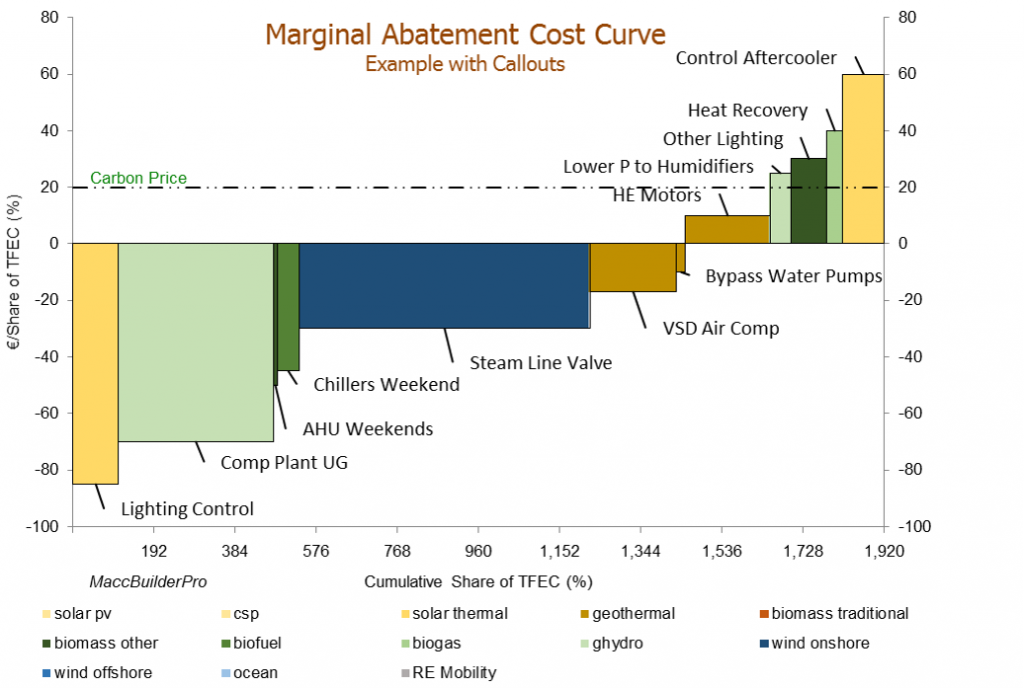
Marginal Abatement Cost Curves are a great way to present a number of alternative projects or policies and their financial performance and environmental benefits. See Niall Enright’s article on this subject for more information about MACCs.
Unfortunately Excel does not natively draw the variable-width columns that are required to create these charts. That is where MACC Builder Pro comes in. It is an Excel spreadsheet which will overcome this limitation and permit high quality MACCs to be easily drawn. It works with Windows versions of Excel 2003 through to 2013, although some of the features will vary from version to version.
MACC Builder pro is a very flexible tool with a large number of options. An example of the MACCs created with MACC Builder Pro can be seen above (click on the image to see the full sized version).
Professional Charting with Categories! With MACC Builder pro, you can get a very professional look to your MACC charts, ideal for incorporation into reports and publications. The example above shows how categories can be used to colour-code different technologies.
Highly Flexible Labelling and Outputs! Project can be labelled using callouts with the project name (as shown above), or with numbering or lettering. These callouts can be dragged and dropped to adjust spacing (not Excel 2003). CHarts can be accompanies by project list to which up 4 of a dozen different data values can be added. Summary Statistics can also be added to the MACC output.
Completely customisable styles! Create you own custom style-set for all the fonts and colours used in MACCBuilderPro. Or use one of the many inbuilt styles, such as “Desert” shown above.
Save Chart setting for later use! You can save the data and settings for an individual chart at any time and restore these as needed. Because MACCBuilderPro is an Excel spreadsheet you can make copies and keep them with client or project files. Never worry about recreating that important chart again.
Innovative Data Presentation! You can communicate project or technology performance in terms of Payback or Internal Rate of Return (IRR) as well as the traditional Marginal Abatement Costs. These forms of presentation may overcome some of the limitations of MACCs and provide alternative ways of showcasing relative strengths and weaknesses of alternative choices. You can even choose a chart based on “variance” from a given value, or you can plot an index line (as seen in the Carbon Price, above).
Integrated with other Office Apps. There is a one-click option to send the MACC charts or project details to Microsoft Word or Powerpoint. Powerpoint can be used to offer additional file export options not offered by Excel.
Purchase a MACC Builder Pro license
From 1st June 2017, MACCBuilder Pro v3.0 is offered as part of the companion files for the book “Energy and Resource Efficiency without the tears – the complete guide to adding value and sustaining change in an organisation”. These files are in a downloadable a zip file (27 MB) containing:
>Over 70 spreadsheet models that build on the data and financial analysis techniques set out in this book. These Excel spreadsheets extend the learning points in this book, and enable practitioners to employ the analysis and presentation techniques set out in this book.
>5 Business case models, as used by the author in investment appraisals.
>Over 200 illustrations and cartoons for use in educational materials and presentations; and 10 posters, summarizing key concepts.
>A lighting hours tool to create daily, weekly or monthly lighting demand profiles based on a place name or coordinates.
>A complete set of certified ISO 50001 process documentation (provided courtesy of Peel Land and Property Group).
>MACCBuilder Pro, a tool to draw Marginal Abatement Cost Curves (version 3, previously sold for £85).
>MATOD a simple M&T spreadsheet system for non-commercial use.
>A software specification document that can form the basis for the selection and procurement of a resource-efficiency tool.


0 Comments